
Capital Efficiency for Startups: An Investor's Guide
Brian Nichols is the co-founder of Angel Squad, an angel investing community where aspiring and active angels learn from Hustle Fund’s approach, review curated deal flow, and connect with peers.
A startup can make a small bank balance look productive or make a large round disappear with little proof to show for it. The hard part for an investor is deciding which result the spending produced. A capital-efficiency review connects cash use to the company’s next meaningful proof point, then tests whether that progress can last. The right evidence changes with the company’s stage and business model.
What capital efficiency means for a startup
Capital efficiency is how effectively a startup converts cash and invested capital into durable business progress. Progress might mean a working product, regulatory clearance, retained customers, gross profit, or repeatable revenue growth. The useful output depends on what the company must prove next.
That definition is broad on purpose. Capital efficiency has no standardized startup formula. A pre-revenue biotech company, a seasonal marketplace, and a subscription software company spend money through different economic engines. Forcing all three into one revenue ratio produces a tidy comparison with weak meaning.
Investors still care about the concept because it reveals financing dependence. Efficient progress can extend runway, create more choices about when to raise, and reduce the amount of future capital needed to reach the next milestone. Weak efficiency can leave a company dependent on another round before the business has earned stronger terms. It never removes startup risk or guarantees a return.
Why one capital efficiency ratio is never enough
A ratio is useful only when its numerator, denominator, and period match the company’s economics. Even common terms can hide different definitions. Carta defines gross burn as total monthly expenses and net burn as gross burn minus monthly revenue. A company may instead use the change in cash balance or another convention. Those numbers can diverge because of financing, debt, equipment purchases, foreign exchange, restricted cash, and working-capital movements.
The output needs a quality check too. Revenue bought with steep discounts and followed by heavy churn is weaker than revenue from customers who stay and expand. A lower burn after one layoff tells you less than a multi-quarter record of better acquisition, retention, margin, and cash use.
Use capital efficiency as a lens with three questions:
- What proof should this company produce at its current stage? A pre-revenue team may need technical validation. A scaling software company may need repeatable sales and retention.
- Which metric best connects spending to that proof? Choose a denominator tied to the economic engine, such as a milestone, retained gross profit, or net-new recurring revenue.
- What could make the result look better than the business is? Check definitions, period selection, cost classifications, annualization, customer prepayments, seasonality, and cohort mix.
Our co-founder and General Partner Elizabeth Yin writes in Democratizing Knowledge, “The more disciplined you are in your thought process/rubric, the more you can improve over time.” A repeatable rubric helps an investor learn from decisions instead of moving the goalposts for each exciting pitch.
Match the evidence to the stage and business model
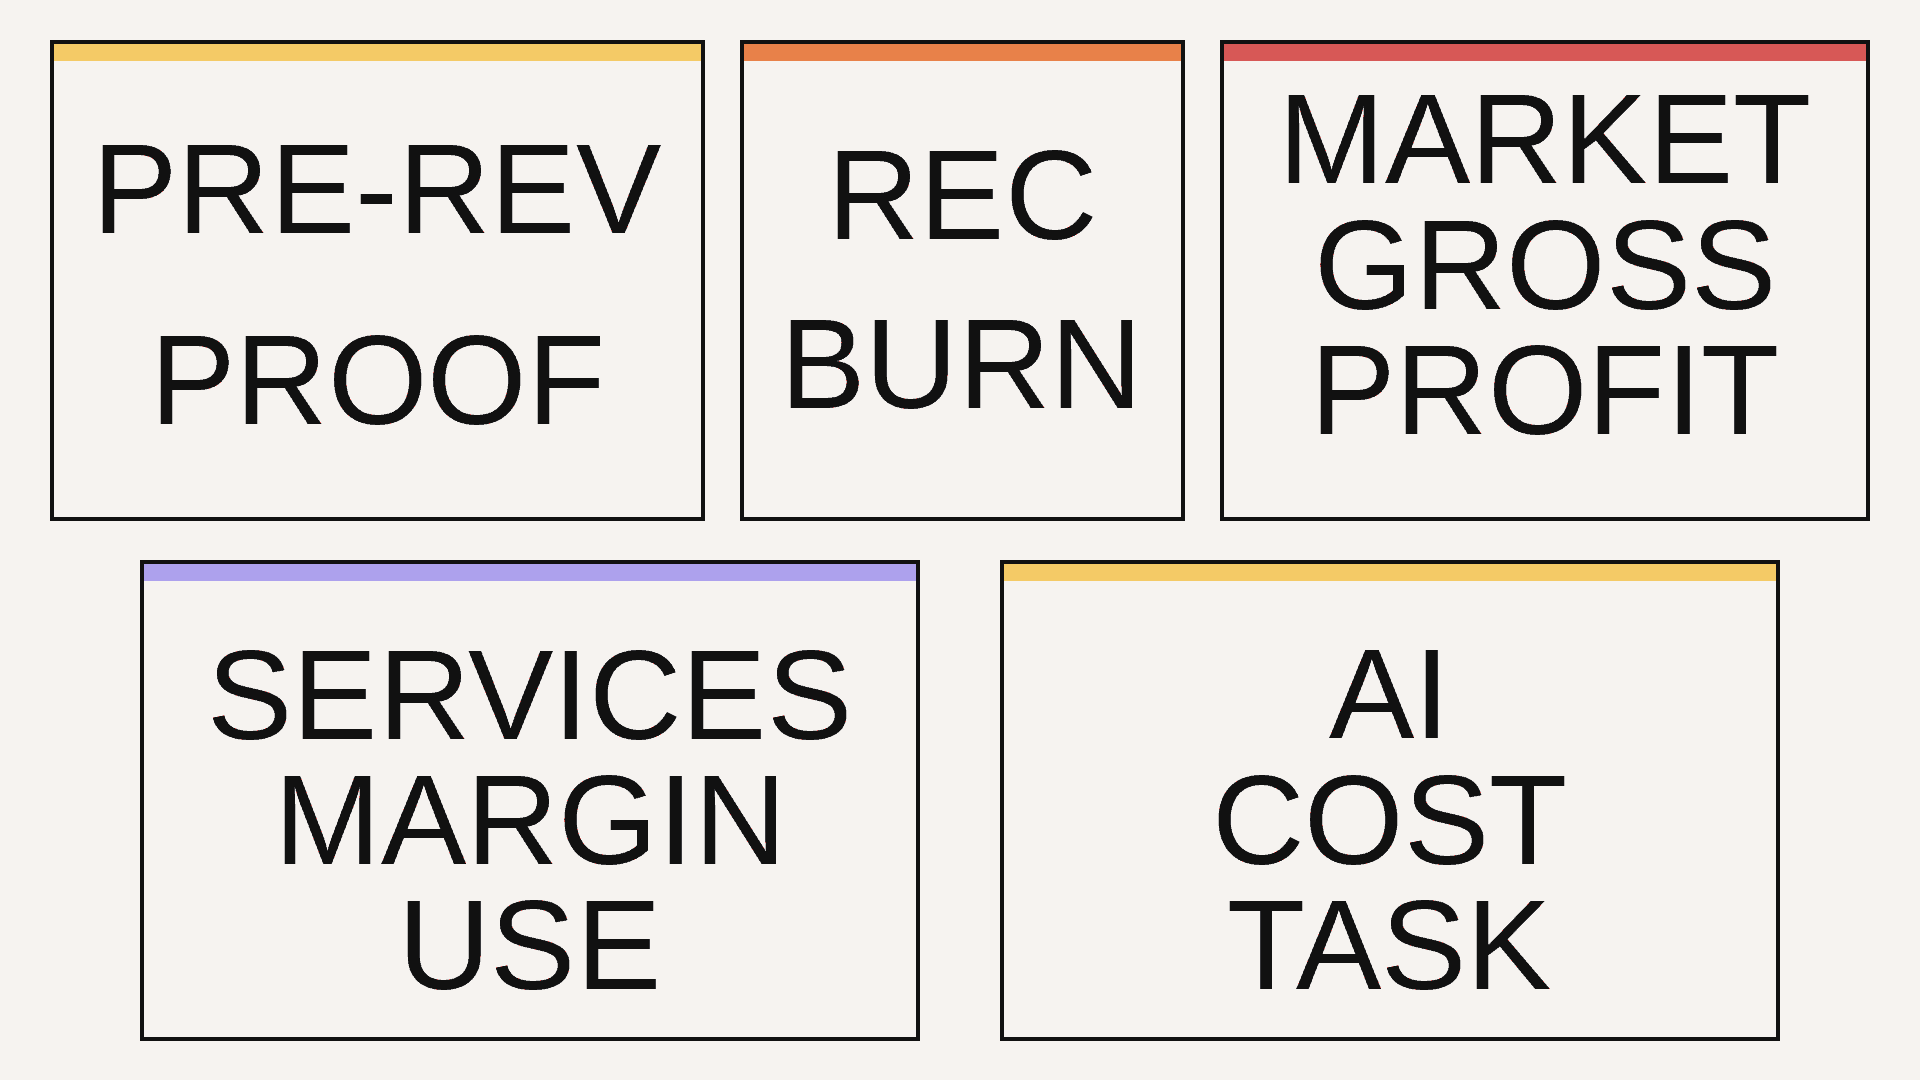
Start with the company’s current proof point and revenue engine. Then select a small set of metrics that explains both progress and cash use.
Pre-revenue companies
Annual recurring revenue (ARR) and customer acquisition cost (CAC) ratios do not help when neither recurring revenue nor a repeatable acquisition motion exists. Review:
- Runway: unrestricted cash divided by a clearly defined burn rate. Treat runway as a conditional estimate because the spending plan will change.
- Milestone delivery: planned cost and time compared with actual cost and time for product, technical, regulatory, or commercial proof points.
- Cash to next proof: the capital still required to reach the specific milestone that can reduce risk or support another financing.
- Learning per experiment: whether small tests eliminate important product, customer, or technical assumptions before the team makes larger commitments.
The milestone must be concrete. “Build the platform” is a workstream. “Complete a pilot that meets the customer’s stated accuracy and response-time requirements” is evidence an investor can inspect. Our guide to startup burn and runway develops this milestone-per-dollar view.
Recurring-revenue software
Burn multiple is a useful starting point once recurring revenue is the economic engine. It divides net burn by net-new ARR for the same period. David Sacks’s original burn multiple definition also makes its boundary clear: the ratio cannot compute when net-new ARR is zero.
Pair it with gross margin, CAC payback, gross and net retention, and runway. Net revenue retention follows the same starting customer cohort and includes expansion, contraction, and churn while excluding new customers. Those companion metrics show whether ARR growth has attractive economics and staying power. Our full burn multiple guide covers trend analysis and calculation cautions.
Marketplaces and transactional businesses
ARR is often the wrong denominator. Gross merchandise value can also overstate the economic output because most of that transaction value may pass to sellers.
Start with retained gross-profit growth, contribution margin, repeat behavior on both sides of the market, and cash burn. Craft Ventures recommends replacing ARR growth with annualized gross-profit growth and using a year-over-year view when seasonality makes quarterly comparisons misleading.
Reconcile gross transaction value, net revenue, cost of goods sold, and gross profit. Classification choices can change a ratio while the underlying marketplace stays the same.
Services and tech-enabled services
Software benchmarks can flatter a services company or punish it for having a different cost base. Review gross margin, contribution margin, staff utilization, revenue or gross profit per employee, backlog quality, and cash conversion.
Separate repeatable product revenue from project work. Ask which delivery costs rise with each customer and which can fall through automation. A company with growing revenue and falling delivery quality is not becoming more efficient.
AI-native products
AI products need their own cost bridge. Inspect inference and other compute cost per completed customer task, contribution margin by product and customer segment, retention, and the gross-margin trajectory.
Ask whether model costs fall because of genuine engineering gains, lower vendor pricing, a change in product mix, or reduced output quality. A high software-style gross margin today means little if usage makes each retained customer more expensive to serve.
Hardware, biotech, climate, and other capital-intensive companies deserve the same stage-aware treatment. Tie spending to technical, manufacturing, regulatory, and commercial milestones. Do not import SaaS ratios into a development cycle that produces value on another schedule.
Simplified recurring-revenue calculation
Hypothetical and simplified example: One recurring-revenue startup burns $900,000 net while adding $1.5 million of ARR during the same period. “Net burn” and “net-new ARR” use the company’s stated definitions and exclude any judgment about revenue quality, cost classification, financing flows, or future performance.
Burn multiple
$900,000 net burn ÷ $1,500,000 net-new ARR = 0.60x
Efficiency score
$1,500,000 net-new ARR ÷ $900,000 net burn = 1.67x
The efficiency score is the reciprocal of the burn multiple when both calculations use the same inputs and period. One expresses cash consumed per dollar of ARR growth. The other expresses ARR growth per dollar of net burn.
Neither number earns a universal “good” or “bad” label. Stage, gross margin, retention, sales payback, revenue concentration, and the time series can change the interpretation. The result also becomes undefined when its denominator is zero. A profitable company with negative net burn needs a different analysis rather than a forced multiple.
Pressure-test a capital efficiency claim
A founder’s dashboard is the beginning of diligence. Rebuild enough of the result to understand what it includes.
- Lock the definitions. Write down exactly what sits inside cash, burn, ARR, CAC, cost of goods sold, gross profit, and retention. Spell out each metric before accepting its acronym.
- Match the periods. Use the same month, quarter, or year for numerator and denominator. Check quarterly history and a trailing-12-month view so one cost cut or seasonal peak does not drive the conclusion.
- Reconcile the cash bridge. Start with prior unrestricted cash. Add financing and operating inflows, subtract operating and investing outflows, and explain the ending balance. Identify debt, equipment, acquisitions, foreign exchange, and working-capital changes separately.
- Inspect cohorts. Split results by customer start date, segment, channel, geography, and product. A blended average can hide newer cohorts with worse retention or payback.
- Test classification choices. Move disputed hosting, inference, implementation, support, contractor, and sales costs into the more conservative category. Recalculate gross margin and payback.
- Bridge actuals to the forecast. Ask what must happen for burn, retention, acquisition payback, and margin to improve together. Compare those assumptions with hiring plans, contracts, capacity, and historical execution.
- Name what the metric misses. Capital efficiency does not establish valuation, product-market fit, defensibility, governance quality, future liquidity, or investor return. Review dilution, debt, liquidation preferences, and financing risk separately.
Definition differences are reconciliation items. They are not automatic evidence of misconduct. A founder who can explain the choices and reproduce the calculation builds more confidence than one who offers a polished ratio with no bridge.
How startups can improve capital efficiency
Cost cutting can extend runway, yet indiscriminate cuts can delay the proof point that makes the company valuable. Better capital allocation connects each expense to a test, operating constraint, or milestone.
- Sequence product-market-fit work: fund the highest-risk assumption before building the broadest product.
- Hire against proven constraints: add capacity when demand, delivery, or technical work has a measured bottleneck.
- Run smaller experiments: cap the cash and time committed before an experiment has clear evidence.
- Improve retention and margin: fix churn, pricing, support load, infrastructure cost, and unprofitable customer segments before buying more growth.
- Plan around milestones: map cash to the next fundable or self-sustaining proof point, including a margin for delay.
Efficiency can conflict with speed. The investor’s job is to decide whether extra spending buys a durable advantage or creates financing dependence. Elizabeth Yin’s capital-allocation reminder is useful here: “Decisions are never in isolation - they are a comparison game.” A follow-on check belongs next to the investor’s other possible uses of that capital, not inside a pass-or-fail efficiency screen.
Capital efficiency compared with adjacent concepts
These terms answer different questions:
- Capital intensity describes how much capital a business model needs to operate or grow. A capital-intensive startup can still deploy that capital efficiently against appropriate milestones.
- Working-capital efficiency focuses on short-term operating assets and liabilities, including receivables, inventory, and payables. It matters greatly for commerce and hardware, but it is only one part of total cash use.
- Return on invested capital (ROIC) compares after-tax operating profit with invested capital. Early-stage startups often lack stable operating profit, which limits its usefulness.
- Return on capital employed (ROCE) usually compares operating profit with capital employed. Accounting definitions and debt treatment differ from startup burn-to-progress measures.
- Bank efficiency ratio generally compares a bank’s non-interest expense with its income. It belongs to bank operating analysis, not startup capital efficiency.
The label “capital efficiency ratio” therefore needs a formula attached. Ask which capital, which output, and which period the speaker means.
Frequently asked questions
What is the best capital efficiency formula for a startup?
There is no universal formula. Match the output to the company’s stage and business model. Pre-revenue companies need milestone and runway evidence. Recurring-revenue software can use burn multiple with margin and retention. Marketplaces may use gross-profit growth, while services and AI products need their own contribution-economics measures.
What is a good capital efficiency ratio?
No threshold is good across every startup. Judge the ratio against the same company’s history, its stage, its economic model, and genuinely comparable companies using the same definitions. A single benchmark should never decide an investment.
Can a pre-revenue startup be capital efficient?
Yes. Review how much cash and time the team needs to retire technical, product, regulatory, or customer risk. A pre-revenue team can be efficient when small, well-designed experiments reach meaningful milestones without premature fixed costs.
Is capital efficiency the same as profitability?
No. Profitability means revenue exceeds expenses under a defined accounting basis. A startup can use capital efficiently while remaining unprofitable because it is investing in growth. A profitable company can allocate capital poorly if new spending produces weak returns or erodes its position.
How often should investors review capital efficiency?
Quarterly history is a useful starting cadence for many startups, with monthly cash and runway monitoring when liquidity is tight. Seasonal businesses also need year-over-year comparisons. Keep definitions stable so movement reflects the business rather than a changed formula.
Turn the rubric into reps
Capital-efficiency judgment improves when you can review real companies, compare definitions, and hear how other investors challenge the same forecast. If you want to build those reps with curated deal flow and peer discussion, apply to Angel Squad.
This content is for educational purposes only and does not constitute investment, legal, tax, accounting, or valuation advice or a recommendation to buy or sell any security. The calculation is hypothetical and simplified, not a projection. Private startup investments are speculative, illiquid, long-term, and may result in total loss. Past results and current marks do not guarantee future results. Eligibility, terms, rights, fees, expenses, carry, taxes, cap-table changes, dilution, valuation policy, timing, follow-on capital, allocations, and outcomes depend on the investor, issuer, offering, governing documents, and financing and exit conditions. Review the governing documents, conduct independent diligence, and consult qualified independent legal, tax, accounting, valuation, and investment professionals before investing.















.png)