
Revenue Multiples: A Practical Guide for Startup Investors
Two startups each report $1 million in revenue. One has 85% gross margins, repeat customers, and rapid growth. The other resells hardware at 20% margins and depends on one customer. Giving both the same 5x revenue multiple would turn a shortcut into a mistake.
Revenue multiples become useful when you define the revenue, choose credible peers, and expose every adjustment. Here is how we use them to build a startup valuation range without pretending the spreadsheet can see the future.
This is general educational information, not legal, tax, or investment advice. Ask qualified, independent legal and tax professionals to review the terms and consequences of any investment.
What a revenue multiple measures
A revenue multiple compares a company's value with the revenue it generates. It is a relative valuation tool: you observe how the market prices comparable companies, then apply a defensible range to the company you are evaluating.
The two common versions use different measures of value:
- Enterprise value to revenue (EV/Revenue) = enterprise value ÷ revenue. Enterprise value represents the operating business for debt and equity capital providers. For a simple capital structure, enterprise value equals equity value plus debt minus cash.
- Price to sales (P/S) = equity value ÷ revenue. For a public company, the numerator is market capitalization. For a private financing, a pre-money equity value divided by revenue is the closest practical equivalent.
Keep the numerator and denominator consistent. Revenue belongs to the whole operating business, so EV/Revenue is usually the cleaner comparison when debt and cash balances differ across companies. P/S can still work when the peer set has similar capital structures and every value is measured on the same basis.
The calculation runs in both directions:
Revenue multiple = company value ÷ revenue
Implied enterprise value = selected EV/Revenue multiple × subject-company revenue
Implied equity value = implied enterprise value + cash - debt
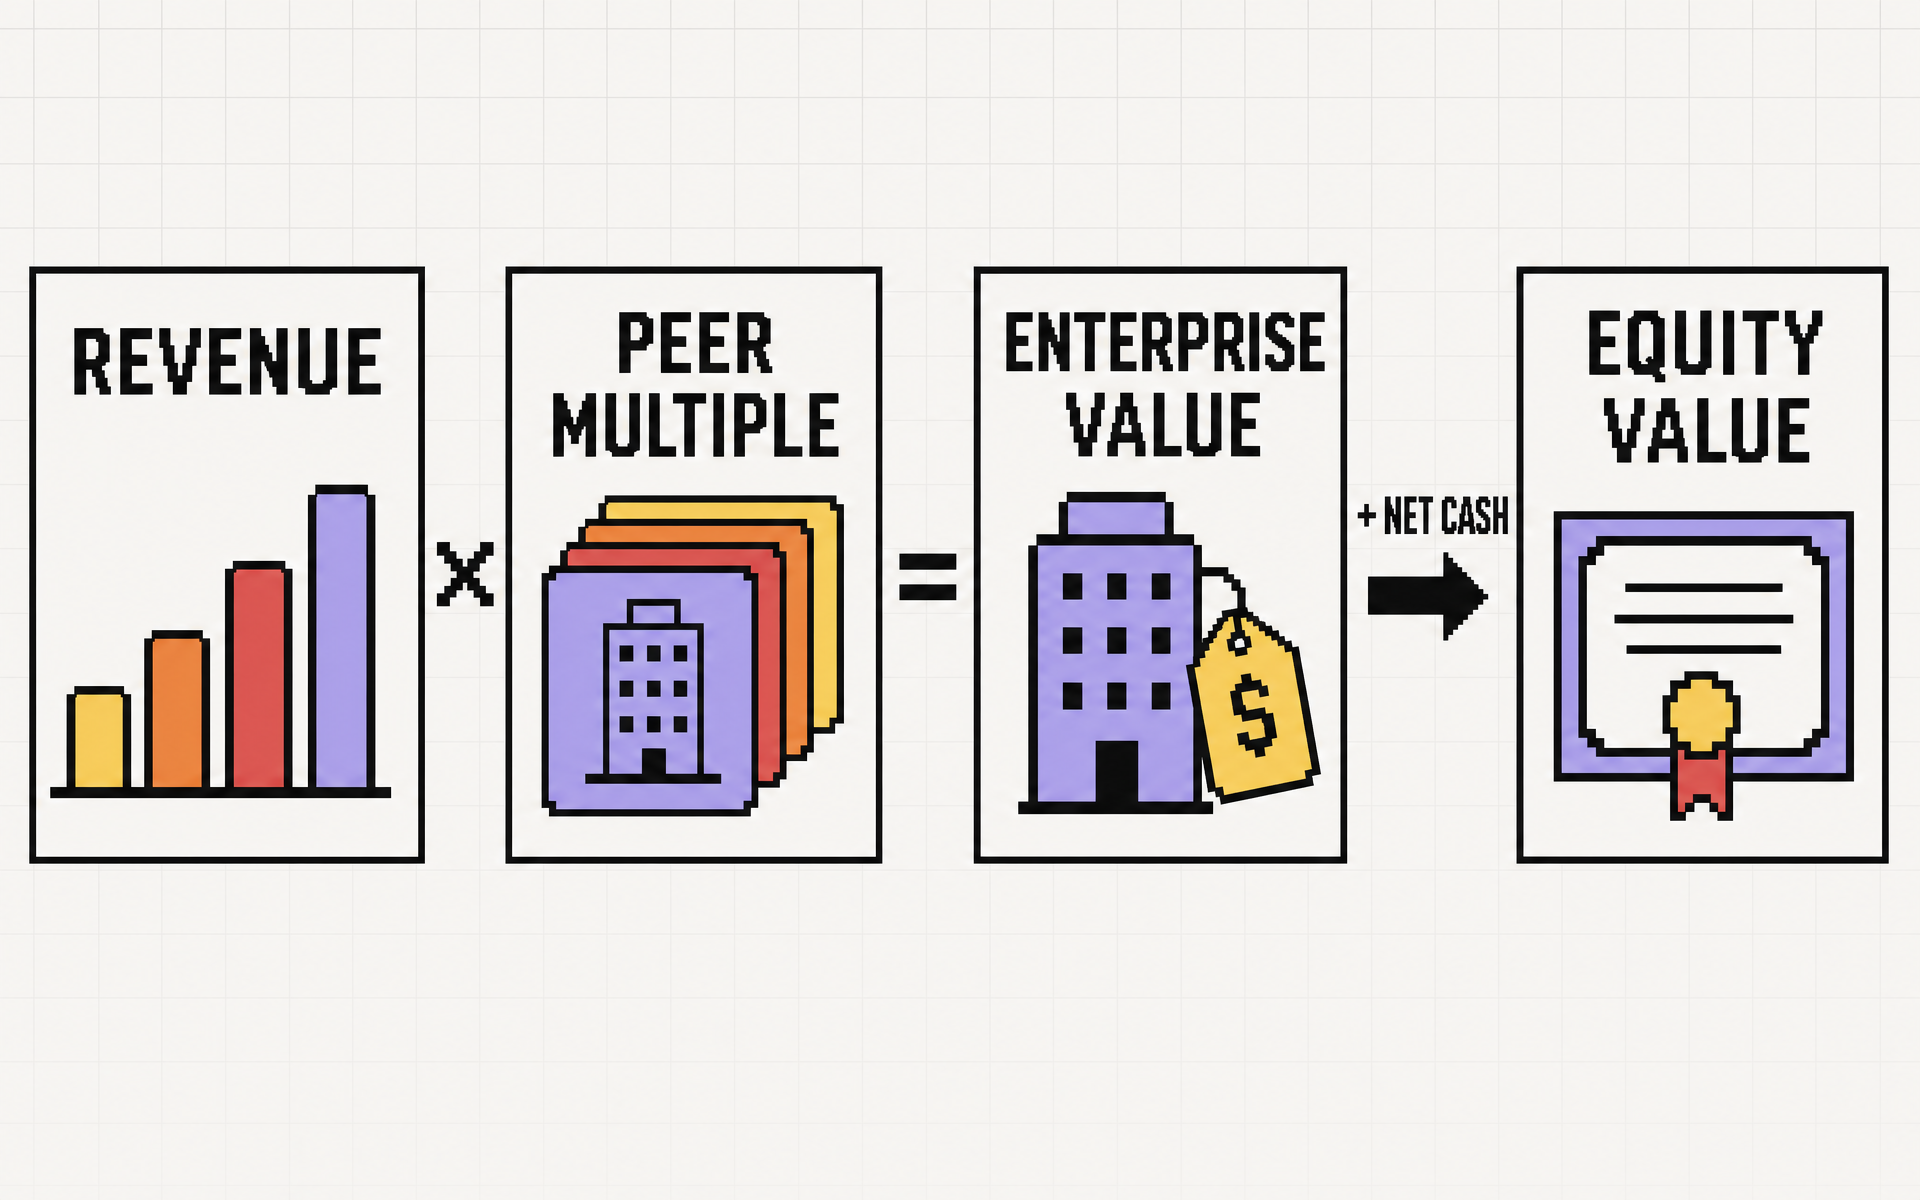
For a financing, freeze the analysis immediately before the new round. Convert enterprise value into pre-money equity value using the company's pre-financing cash and debt. Add the new investment once to reach post-money value. When the forecast already assumes that new capital will fund growth, say so. Adding the cash again can double count part of the financing.
Define the revenue before debating the multiple
“5x revenue” is incomplete. The price can change by millions depending on which revenue figure sits under the multiple.
Suppose a startup has $2.4 million of revenue over the last 12 months, $3 million of current annual recurring revenue, and a $4.5 million next-12-month forecast. At 5x, those denominators imply values of $12 million, $15 million, and $22.5 million. Same company. Same headline multiple. Very different answer.
Label the denominator every time:
- Last 12 months (LTM) or trailing 12 months (TTM) revenue is recognized revenue from the prior year. It is grounded in actual results, though it can lag a fast-growing company.
- Next 12 months (NTM) revenue is a forecast. It gives growth credit sooner and carries more execution risk.
- Annual recurring revenue (ARR) annualizes recurring subscription revenue at a point in time. ARR is an operating metric rather than a standardized accounting measure, so reconcile it to recognized revenue and the underlying customer schedule.
- Run-rate revenue annualizes a recent month or quarter. A seasonal spike, new contract, churn event, or one-time service fee can make it look healthier than the business really is.
Also check what the company calls revenue. A marketplace with $50 million of gross merchandise value and a 10% take rate generates $5 million in platform fees before other accounting adjustments. Applying a software revenue multiple to the $50 million transaction volume would produce nonsense. Hardware, implementation, consulting, and pass-through costs deserve the same scrutiny.
Choose comparable companies that share the economics
An industry label is only the first filter. A usage-based infrastructure platform, vertical software company, consumer subscription app, and IT consultancy can all appear under “software” while earning very different margins and retention.
Good comparable companies resemble the target across the drivers that create future cash flow:
- Business model and revenue mix. Match subscriptions with subscriptions, marketplaces with marketplaces, and hardware-heavy companies with similar mixes.
- Stage and scale. A $2 million ARR startup faces different customer, financing, and execution risks from a $2 billion public company.
- Growth and margins. Compare year-over-year growth, gross margin, operating margin, and the path toward cash generation.
- Retention and customer profile. Contract length, net revenue retention, churn, customer concentration, and buyer type affect revenue durability.
- Market and capital needs. Competition, market size, regulatory exposure, sales cycles, and future financing requirements all matter.
- Date and transaction type. Public trading multiples, private rounds, and acquisitions price different securities under different conditions. Stale boom-year transactions do not describe today's market.
“Angel investing or VC is a comparison game.”
Elizabeth Yin, Hustle Fund co-founder and general partner
Start with a broad list, explain every exclusion, and keep the five to ten closest peers when the data supports that many. Use the median as a center point, then show a lower and upper range. A single average can hide one distressed company and one hype-driven outlier.
Public peers are useful because their prices and financial statements are visible. They also tend to be larger, more liquid, and more mature than the startup. Acquisition precedents may include control and strategic premiums. Private financing values can reflect preferred terms, investor demand, and ownership targets. There is no automatic “private-company discount” that fixes all of those differences.
In Angel Squad, our angel-investing community, members learn how our Hustle Fund team evaluates early-stage companies, review deal memos, and compare assumptions with experienced operators and other investors. Those repetitions help when clean private-company comparables are scarce.
Academic peer-selection research reached a similar practical conclusion: valuation-based peer selection improved predictions of future EV/Sales and price-to-book ratios compared with other selection techniques. The company name matters less than the economics underneath it.
What pushes a revenue multiple up or down
A multiple is a compressed forecast. Higher multiples usually reflect a stronger expectation that today's revenue will grow into durable, high-margin cash flow. Lower multiples usually reflect weaker growth, lower-quality revenue, more capital needs, or greater risk.
Focus on these drivers:
- Growth rate. Faster growth can support a higher multiple when it is repeatable. Annualizing one exceptional month is weak evidence.
- Gross margin and revenue mix. One dollar of high-margin recurring software revenue has different economics from one dollar of pass-through advertising spend or hardware sales.
- Retention. Strong cohort retention and expansion make future revenue more visible. Investigate the calculation because companies define net and gross retention differently.
- Customer concentration. Losing one customer should not erase the growth story. A startup with 40% of revenue from one account deserves a different risk range from a diversified peer.
- Efficiency and capital intensity. Growth that consumes less cash leaves more value for shareholders and reduces dependence on another funding round.
- Market durability. Product differentiation, switching costs, competitive pressure, regulation, and the plausible market size shape how long growth can last.
- Profitability and burn. Revenue multiples allow comparisons when earnings are negative, but they do not make losses irrelevant. The path to cash generation still matters.
- Market conditions. Interest rates, risk appetite, exit markets, and sector sentiment move public and private multiples over time.
For B2B software, SaaS Capital's private-company framework uses the public market multiple, ARR growth, and net revenue retention as three central inputs. Its current index also warns that self-reported retention figures are difficult to compare without recalculating them from customer-level data. That is a useful standard for any recurring-revenue comp set.
What is a good revenue multiple in 2026?
A good revenue multiple is one supported by a coherent peer group, the same denominator, and current market data. A universal “good” number does not exist.
Current public-market data shows why. In January 2026 sector data, Aswath Damodaran reported these US EV/Sales figures:
- 1.47x for food processing
- 2.53x for business and consumer services
- 3.46x for the total market excluding financial companies
- 5.31x for healthcare information and technology
- 11.41x for system and application software
- 15.70x for semiconductors
Those are sector-level public-company figures. They show the spread created by margins, growth, capital intensity, and market expectations. They do not set a private startup's price.
A more focused dataset can produce a very different reference point. The SaaS Capital Index reported a 3.82x median market-cap-to-current-run-rate-revenue multiple across 63 public B2B SaaS companies on July 31, 2026. It uses market capitalization instead of enterprise value and excludes consumer SaaS, very small-customer models, mixed software and hardware revenue, and consolidators.
Do not average 3.82x and 11.41x. First ask why the universes and formulas differ. Then select the dataset whose companies, revenue definition, value measure, and date best match your target.
Startup stage changes how much weight the multiple deserves
Pre-revenue and pre-seed: The multiple is undefined. Projecting year-three revenue and applying a public multiple can still test the size of the outcome, though it rests on several fragile assumptions. Give more weight to founder insight, product evidence, market pull, speed, capital needs, and stage-matched financing comps. Our guide to earliest-stage traction covers the signals available before revenue becomes meaningful.
Early revenue: Show LTM revenue, current run rate, and a scenario-based forecast side by side. A handful of contracts may reveal demand while providing too little history for a precise multiple.
Repeatable seed and Series A revenue: Revenue multiples become more informative once the company has cohorts, renewal history, and a repeatable sales motion. Growth, retention, margin, and burn still determine where the startup belongs inside the range.
Growth and late stage: Public peers and transaction precedents carry more weight as the company's reporting, scale, and business model mature. Normalize fiscal periods, accounting definitions, stock-based compensation treatment, cash, and debt.
Mature and profitable: An EBITDA or free-cash-flow measure may explain value better because it captures cost structure. Keep revenue multiples as a cross-check, especially when peer margins vary.
A worked startup revenue multiple example
Consider an illustrative vertical B2B software startup with:
- $2.4 million in LTM revenue
- $3 million in current ARR
- 68% year-over-year growth
- 82% gross margin
- 116% net revenue retention
- $1.2 million in cash and $400,000 in debt before financing
- A planned $3 million equity round
After reviewing eight peers on the same date and revenue basis, assume your low and high cases use 4.5x and 6.0x EV/current ARR. These are illustrative inputs, not a current market recommendation.
Low case: $3 million × 4.5 = $13.5 million enterprise value.
High case: $3 million × 6.0 = $18 million enterprise value.
The company has $800,000 of net cash, so the implied pre-money equity range is $14.3 million to $18.8 million. Adding the $3 million round once produces a post-money range of $17.3 million to $21.8 million.
Now translate the founder's ask. A $20 million pre-money value implies a $19.2 million enterprise value after subtracting net cash. That equals 6.4x current ARR or 8.0x LTM revenue. Both labels should appear in your memo because each tells a different story about the price.
Forecasts can blur this arithmetic. If the new $3 million is required to produce the NTM revenue, the forecast already assumes the financing. Damodaran's explanation of pre-money and post-money pricing shows why adding capital mechanically to a value based on financed growth can count it twice. Write down the valuation date, operating plan, and financing assumption.
Revenue multiple diligence checklist
Before accepting the result, answer these questions:
- Is the denominator LTM revenue, NTM revenue, ARR, or run-rate revenue?
- Does the figure reconcile to financial statements, invoices, contracts, and customer-level data?
- Are one-time services, hardware, pass-through costs, gross merchandise value, and other non-comparable revenue separated?
- Do the peers share the business model, scale, growth, margins, retention, customer profile, and market?
- Are all multiples measured on the same date and value basis?
- Did you distinguish enterprise value from equity value, then pre-money from post-money value?
- What do the downside, base, and upside cases assume about growth, churn, margins, burn, and future capital?
- Does the entry price leave room for dilution and a plausible exit outcome?
- Do security terms or other claims change the economics beyond the headline valuation?
“The more disciplined you are in your thought process/rubric, the more you can improve over time.”
Elizabeth Yin, Hustle Fund co-founder and general partner
Save the comp set, source data, exclusions, and scenario assumptions with the investment memo. When the outcome differs from the model, you can see which judgment failed and improve the next one.
A defensible entry multiple cannot prevent a startup from failing. Valuation is one part of diligence and portfolio construction, never a substitute for either.
When another valuation method deserves more weight
Revenue multiples lose usefulness when revenue says little about future cash flow. Use another method as the primary lens when:
- The startup has no revenue or only a few experimental customers.
- A biotech or deep-tech company's value depends on technical and regulatory milestones.
- A marketplace reports transaction volume that dwarfs its take-rate revenue.
- Project revenue is lumpy and backlog quality varies widely.
- Hardware, services, and software have sharply different margins.
- A mature company has stable earnings that support EBITDA or cash-flow analysis.
- A bank, insurer, or lender treats debt as an operating input, making standard enterprise-value comparisons awkward.
Our broader startup valuation guide explains how comparables fit alongside the scorecard, Berkus, venture capital, and discounted cash flow methods. Agreement among several imperfect methods is more useful than false precision from one.
Use the multiple to ask better questions
Revenue multiples turn a price into questions you can investigate: Which revenue is real? Which peers belong? What growth, margin, and retention justify the range? What has to happen for the entry valuation to support an attractive outcome?
If you want to build that judgment with our investing team and a community of operators, apply to Angel Squad. You will get the education, deal exposure, and peer feedback that make each valuation exercise more informed than the last.















.png)