Technology Adoption Curve for Startup Investors
Brian Nichols is the co-founder of Angel Squad, an angel investing community where aspiring and active angels learn from Hustle Fund’s approach, review curated deal flow, and connect with peers.
A startup can have enthusiastic users and still struggle to sell to its next customer. The technology adoption curve gives investors a way to understand that gap. Its five groups help you examine who’s buying, what they need, and how much has to change before demand broadens.
What is the technology adoption curve?
The technology adoption curve groups people or organizations by how early they adopt an innovation relative to others in a defined population. Everett Rogers popularized the framework in Diffusion of Innovations, first published in 1962.
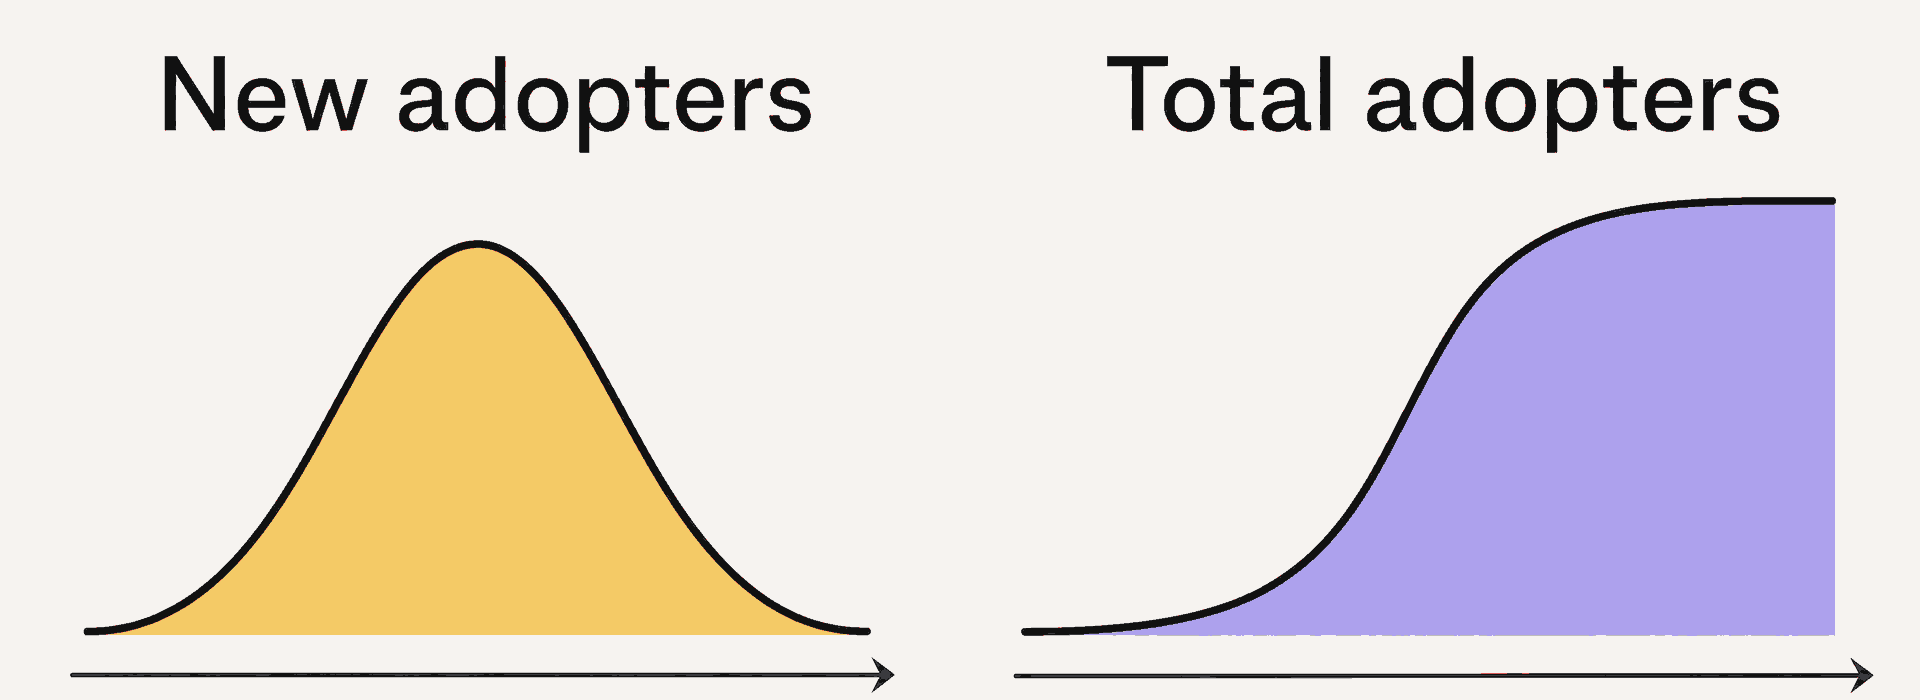
The familiar bell curve shows new adopters in each period. Add those adopters together over time and the same idealized pattern becomes an S-curve of cumulative adoption. Neither shape supplies a calendar for a startup’s growth.
The five adopter groups
Rogers’ adopter classification divides a normal distribution, the statistical bell shape, into five groups. The conventional group shares are 2.5%, 13.5%, 34%, 34%, and 16%. They’re idealized divisions among adopters, excluding nonadopters, rather than measured shares of every potential market.
Here’s how we’d apply the groups to startup diligence. The examples are hypothetical.
1. Innovators, 2.5%
Innovators are the earliest experimenters, comfortable with uncertainty and technical complexity.
Imagine a developer who uses a startup’s unfinished tool, writes a connector, and reports bugs. That activity gives the founder useful product feedback. It leaves the budget question open.
Ask what the user would pay for, how often the tool solves a real problem, and how much unpaid implementation work the customer contributed. A product that depends on that effort may struggle with buyers who lack the time or skills.
2. Early adopters, 13.5%
Early adopters embrace an innovation early and can influence peers.
A logistics executive might become a design partner, a customer who helps shape an early product, because a new routing system could solve an expensive problem. They might tolerate missing features in exchange for influence over development.
Ask whether the customer’s requirements recur across other accounts. One deeply involved buyer can pull a startup toward a custom project. Several unrelated buyers paying for the same core solution give you more evidence of repeatable demand.
3. Early majority, 34%
The early majority takes a more deliberate approach to adoption.
For a startup selling business software, this buyer might want a reference from a similar company, dependable implementation, and support when something breaks. The founder’s vision alone may carry less weight.
Ask what happened in the latest sales conversations with buyers outside the founder’s network. A stalled security review or missing integration gives you a specific obstacle to evaluate. Calling every hesitant prospect an early-majority buyer explains very little.
4. Late majority, 34%
The late majority is more skeptical and adopts later, as uncertainty falls and adoption becomes more common.
A hypothetical regional operator might replace an older system once suppliers expect the new format and migration becomes affordable. The product’s novelty has little appeal to that buyer.
Ask whether the startup can serve this customer at an acceptable cost. Migration help, training, and ongoing support can make a sale expensive even when the customer accepts the category.
5. Laggards, 16%
Laggards are the last adopters in the classification, often attached to established practices.
The label can hide sensible constraints. A small operator may lack the budget, connectivity, or staff to change systems. The existing process may still meet their needs.
Ask whether these buyers belong in the startup’s reachable market at all. A forecast that assumes everyone eventually buys can overstate the opportunity. Nonadopters also sit outside the completed five-group classification.
The assumptions behind the curve
The model needs a defined innovation, population, and meaning of adoption. “Artificial intelligence is taking off” leaves all three unclear. A warehouse team trying a free chatbot and a manufacturer deploying an automated inspection system have made very different commitments.
Rogers’ framework also treats adoption timing as relative. A company can adopt one technology early and another late. The groups simplify a continuous range of behavior; they aren’t permanent personality types.
For an investment decision, spell out these assumptions:
- Population. Name the geography, customer type, company size, and workflow. A global category statistic may say little about the startup’s first reachable segment.
- Adoption event. Separate a signup, trial, paid pilot, production deployment, and renewal. Choose the event that reflects the customer commitment behind the revenue plan.
- Time period. Use comparable periods and customers. A rise in demos after a launch campaign measures something different from sustained growth in paid deployments.
- Possible nonadoption. Leave room for customers who never switch, abandon the product, or choose a different solution.
The conventional first two groups add up to 16%. That arithmetic doesn’t establish a universal tipping point. It cannot tell you that a startup has crossed into mainstream demand, or that the remaining market will follow.
Use customer evidence to judge market timing
We connect the adoption curve to market pull, our lens for how quickly customers adopt a product. Our co-founder and general partner Elizabeth Yin wrote, “Loosely, I define it as how quickly customers adopt your product.”
The curve helps describe potential buyers. Market pull brings the discussion back to their behavior. Work through five questions before giving a startup a position on the curve.
1. Which market is adopting?
Separate category adoption from adoption of this startup’s product. A mature category can support a new entrant with better distribution or a solution for an underserved customer. An expanding category can also leave a particular startup behind.
Eurostat’s 2025 enterprise data puts artificial intelligence (AI) use at about 20% among European Union (EU) enterprises in the covered sectors with at least 10 employees and self-employed persons combined. The share was about 55% for large enterprises, those with at least 250 employees and self-employed persons combined. The measure covers use of at least one AI technology.
Those figures describe different populations within the same broad category. Neither tells you how many companies will buy a particular startup’s product. A total addressable market (TAM) estimate also misses acquisition friction and market pull, as our discussion of TAM’s blind spots explains.
2. What have customers committed?
Ask for the path from interest to repeated use. Useful records include dated sales opportunities, pilot agreements, invoices, product activity, implementation work, renewals, and cancellations. Each answers a different question.
- Interest supports the claim that the problem attracts attention.
- A paid pilot supports willingness to spend on an experiment.
- Production use supports the claim that the product fits a working process.
- Renewal or expansion supports continued value after the initial purchase.
These are different commitments, not mandatory stages for every business. A consumer subscription may produce evidence quickly. An industrial deployment may take much longer. Match the evidence to the business and the decision you’re making.
Look at customers who stopped as well as those who stayed. With the founder’s permission, speak to users, budget owners, and implementers. Their accounts can differ because they bear different costs.
3. What changed that makes buying possible now?
A useful timing argument names a change and connects it to customer action. Lower delivery costs, a new distribution channel, better infrastructure, or a worsening operating problem can create an opening.
Ask the founder to explain the chain of events. If a product became cheaper to deliver, did the new price bring in paying customers? If a workflow became harder, did buyers allocate a budget? General excitement about a technology is weak evidence for either claim.
Also separate obstacles the team controls from dependencies it doesn’t. A missing connector may be a product task. Waiting for customers to replace their entire operating system creates a different timing risk.
4. What does the next buyer need?
Geoffrey Moore’s Crossing the Chasm, first published in 1991, addresses the transition from early adopters to mainstream buyers. His central distinction is that pragmatist buyers want proof in use cases and customers they recognize. An enthusiastic early adopter may be a weak reference for them.
Translate that into a narrow customer question. Does the next buyer need a peer reference, a reliable deployment process, a particular integration, or a clearer business case? Then ask what delivering it costs.
A different sales pitch won’t resolve every adoption barrier. The startup may need a more complete product and a different way of selling and supporting it.
5. Can the company reach that buyer before cash runs out?
A market can be promising while the startup’s timeline remains difficult. Connect each adoption dependency to the operating plan and runway, the time the company can operate before it needs more cash.
Ask which milestones the current financing is intended to fund. Useful milestones might include unrelated customers paying for the same product, a deployment without founder involvement, or renewals from an early customer cohort, a group that started in the same period.
There’s no universal customer count or sales-cycle cutoff that proves readiness. You’re assessing whether the planned work can produce meaningful evidence with the time and money available.
A hypothetical startup with two different adoption stories
Imagine a startup selling maintenance-planning software to small manufacturers. It has 12 pilot customers, and the founder describes the category as entering the early majority.
The customer history could support very different investment judgments:
- Mostly experimentation. Ten pilots came through the founder’s former colleagues. Two pay. Each installation needs custom data cleanup, and maintenance teams rarely use the recommendations. The evidence supports interest and a few working relationships. Repeatable adoption remains uncertain.
- An emerging repeatable segment. Eight pilots pay, several came through customer referrals, and the same maintenance workflow recurs across accounts. Users return during their normal planning cycle. Recent deployments need less founder time. That supports a narrower claim about demand within this segment.
These are illustrative scenarios, not benchmarks. Even the second startup could struggle to retain customers, compete, or make money serving them.
The adoption label contributes little until you understand the customers behind it. In the first scenario, you’d want evidence that users get recurring value from a standard product. In the second, you’d focus on renewal behavior, acquisition costs, and whether the pattern extends beyond the initial segment.
Keep the model’s limits in your investment memo
A curve drawn over a pitch deck can make uncertain assumptions look settled. Keep four limits visible:
- No built-in clock. The curve doesn’t predict when adoption accelerates or how long a startup must survive before it does.
- No automatic market completion. An innovation can stall, lose users, or be replaced. Late adoption and permanent nonadoption are different outcomes.
- No company-level guarantee. Category growth doesn’t establish this company’s distribution, retention, margins, or defensibility. A funding-round label doesn’t establish its adoption stage either.
- No investment verdict. An early market can require more patience and capital than you can supply. A mature market can still contain an attractive opening. Price, team, competition, and your portfolio constraints remain part of the decision.
Record a provisional adoption view, the customer evidence supporting it, the largest uncertainty, and the next event that would change your mind. In Democratizing Knowledge (2021), Elizabeth Yin writes, “The more disciplined you are in your thought process/rubric, the more you can improve over time.”
Startup investing is risky, and most of your bets may fail. A documented view makes your reasoning easier to revisit as evidence arrives; it cannot remove that risk.
To practice evaluating customer evidence with curated deal flow and peer discussion, apply to Angel Squad.