
Burn Multiple: How Investors Read Startup Capital Efficiency
A founder says the company burned $1.2 million and added $800,000 of annual recurring revenue. Is that efficient, worrying, or meaningless?
The answer depends on what went into both numbers and how they changed over time. Burn multiple gives angel investors a fast way to connect cash consumption with recurring-revenue growth. Used carelessly, it can also reward cash-flow timing and hide a shrinking business. Here is how we calculate it, pressure-test it, and use it in startup diligence.
What burn multiple measures
Burn multiple measures how much net cash a company consumes to add one dollar of net new annual recurring revenue (ARR):
Burn multiple = net cash burn ÷ net new ARR
A 1.5x burn multiple means the company consumed $1.50 of cash for every $1.00 of net new ARR added during the same period. Lower is generally better when net new ARR is positive.
David Sacks popularized the metric in 2020 as a way to put growth in the context of investment. His original definition reversed Bessemer Venture Partners' efficiency score so that burn sits in the numerator. That makes the result intuitive: more dollars burned for each dollar of growth means weaker capital efficiency.
Burn multiple answers a different question from two related metrics:
- Burn rate measures how much cash the company consumes per month. It tells you the speed of spending. Our burn-rate guide explains what sits behind that figure.
- Runway estimates how long the current cash balance will last at a given burn rate. It tells you how much time remains.
- Burn multiple compares cash consumed with recurring-revenue growth. It tells you what the spending produced.
A company can have high burn and a reasonable burn multiple if it is adding ARR quickly. Another company can look frugal in absolute dollars while producing almost no growth. The ratio helps you distinguish those cases.
How to calculate burn multiple correctly
The division is easy. Building two trustworthy inputs takes the real work.
1. Lock the measurement period
Use the same opening and closing dates for net burn and net new ARR. A quarter is responsive enough for board and investor review. A trailing 12-month view smooths annual billing cycles, large customer wins, and lumpy expenses. We like seeing both.
ARR is already an annualized run-rate measure. For a quarterly burn multiple, use the change between ARR at the start and end of the quarter. Do not multiply that change by four.
2. Calculate net cash burn
Net cash burn is the cash consumed by ordinary operations during the period. Start with the cash-flow statement, include recurring capital expenditures and capitalized product-development costs, and remove financing flows such as equity proceeds, new debt, and debt repayments. Exclude acquisitions and other one-off investing activity from the operating comparison.
If management uses operating loss, EBITDA, or the change in the bank balance instead, ask for a reconciliation to cash burn. Working capital, annual customer prepayments, capital expenditures, and financing activity can make those figures diverge.
3. Calculate net new ARR
The cleanest check is:
Net new ARR = ending ARR − beginning ARR
An ARR waterfall should reach the same result:
Net new ARR = new-customer ARR + expansion ARR − contraction ARR − churned ARR
Use one ARR policy throughout the period. Exclude professional services, setup fees, hardware, unsigned contracts, and other non-recurring revenue. Our ARR calculation guide goes deeper on the denominator.
ARR is a company-defined operating metric. It has no standardized meaning, so two companies can use the same label for different inputs. SailPoint, for example, says in an SEC-filed disclosure that its ARR includes some expired contracts while renewals are still being negotiated. That policy may be reasonable for its reporting, but an investor needs to know it exists.
4. Divide and preserve the raw inputs
Suppose a SaaS startup begins the quarter with $5 million in cash and ends with $3.8 million. It had no financing or unusual investing activity, so net burn was $1.2 million.
The company began with $3 million of ARR. During the quarter it added $750,000 from new customers and $150,000 from expansions, then lost $50,000 to contractions and $150,000 to churn. Net new ARR was $700,000, and ending ARR was $3.7 million.
Burn multiple = $1.2 million ÷ $700,000 = 1.71x
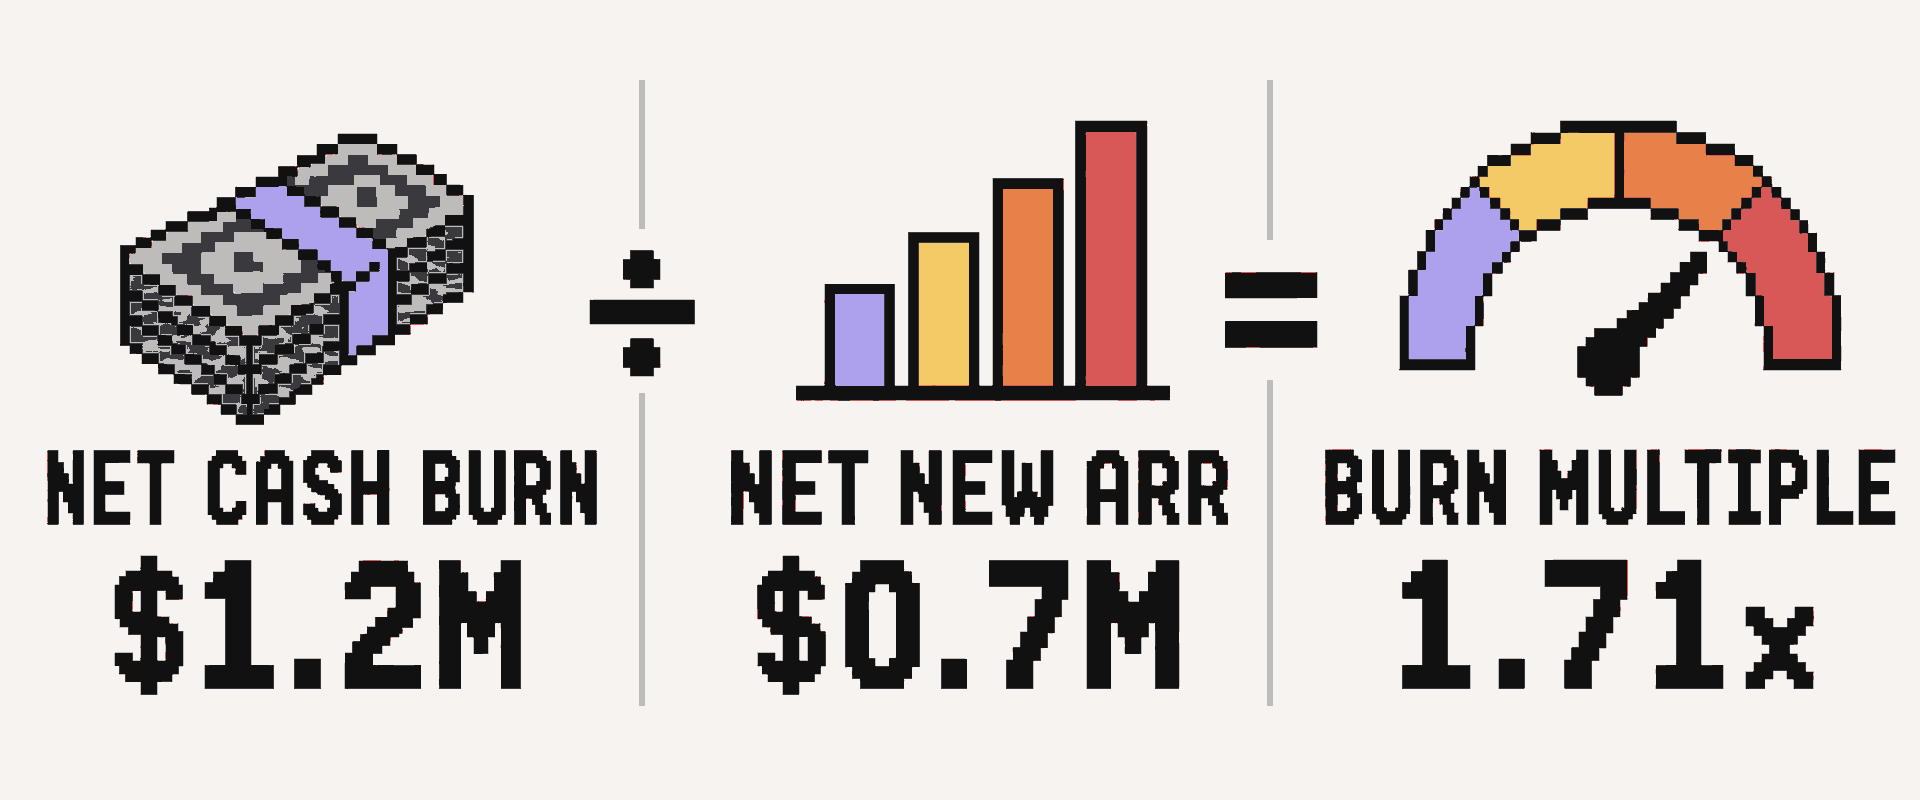
The company burned about $1.71 for each dollar of net new ARR. That is a whole-company efficiency measure. It is not the cost to acquire one customer, and it says nothing by itself about gross margin or retention.
Preserving those raw inputs is a habit we reinforce in Angel Squad, our angel-investing community. Members learn diligence frameworks and compare interpretations with experienced operators and peers, which helps expose a ratio that rests on mismatched definitions.
The calculation traps investors should catch
A clean-looking ratio can still be wrong. These are the traps we see as most consequential:
- Mismatched dates. Dividing one quarter of burn by a full year of ARR growth produces a flattering fiction.
- Financing inside burn. A fresh fundraise can make the cash balance rise even while operations consume cash. Bank-balance change alone would show negative burn.
- Cash timing mistaken for efficiency. Annual prepayments may improve one quarter's cash flow. Delayed vendor payments can do the same. The trailing view reveals whether the improvement holds.
- ARR policy changes. Adding pilots, services, or contracts that have not started inflates the denominator. Changing the definition midyear breaks the trend.
- Acquired ARR. Buying a company can add recurring revenue without proving the core business generated it efficiently. Separate organic net new ARR from acquired ARR.
- A tiny denominator. When net new ARR is close to zero, a small change in churn or one contract can swing the multiple wildly. Show the raw dollars instead of pretending the ratio is stable.
A negative burn multiple is ambiguous
Many metric guides treat any negative burn multiple as good. The signs of both inputs determine the answer.
- Cash generation plus positive ARR growth: net burn is negative and net new ARR is positive. The negative result reflects a cash-generative, growing company.
- Cash burn plus ARR contraction: net burn is positive and net new ARR is negative. The equation also produces a negative result, even though the company is spending cash while shrinking.
- Zero net new ARR: the multiple is undefined. Report it as not meaningful and show burn alongside flat ARR.
- Both inputs negative: a cash-generative company with shrinking ARR produces a positive ratio. Burn multiple is a poor lens for that situation.
Never rank negative burn multiples without showing the numerator and denominator. The raw signs carry more information than the quotient.
What is a good burn multiple in 2026?
The familiar rules of thumb from Sacks are:
- Below 1.0x: exceptional efficiency
- 1.0x to 1.5x: strong
- 1.5x to 2.0x: generally healthy
- 2.0x to 3.0x: investigate
- Above 3.0x: serious efficiency concern outside an explainable early investment phase
Those bands start a conversation. They cannot finish one.
“Going back to first principles is super important since the market always changes and evolves.”
Elizabeth Yin, Hustle Fund co-founder and general partner, Democratizing Knowledge
The fresh data has a wide spread. In Benchmarkit's 2026 software benchmarks, the 62 companies that supplied burn-multiple data had a median of 1.0x. Roughly one quarter reported 0.4x or less, while one quarter reported 2.0x or more. Median results ranged from 1.3x for companies with $5 million to $20 million of ARR to 0.5x for companies with $50 million to $100 million.
Treat those figures as a reference point. The sample is small, private-company data is self-reported, and the right peer group depends on ARR, growth, gross margin, go-to-market model, and stage.
Definitions also change the benchmark. A Scale Venture Partners dataset covering several hundred private and public SaaS companies found that burn multiple generally declined as ARR increased. Scale used operating income in place of net cash burn for consistency across its dataset. That makes its benchmarks useful within its own method and risky to compare with a founder's cash-based figure without a reconciliation.
Stage and business model matter too:
- Pre-revenue startups: burn multiple is undefined. Evaluate burn against product, technical, regulatory, or customer-learning milestones.
- Early SaaS startups: a high multiple may reflect the fixed cost of building product and an initial go-to-market motion. The plan and direction matter more than a single quarter.
- Scaling SaaS startups: efficiency should usually improve as recurring revenue absorbs fixed costs and the sales engine becomes repeatable.
- Hardware, biotech, services, and marketplaces: SaaS thresholds can mislead. Gross-profit growth, contribution margin, milestone progress, working-capital needs, and runway may provide better evidence.
A low multiple can also signal underinvestment. If a company protects cash by stopping product development or starving a working acquisition channel, today's ratio may improve while future growth weakens. Capital efficiency means funding productive growth, not minimizing every expense.
How we use burn multiple in investor diligence
A single ratio is a snapshot. A repeatable rubric turns it into evidence.
“The more disciplined you are in your thought process/rubric, the more you can improve over time.”
Elizabeth Yin, Hustle Fund co-founder and general partner, Democratizing Knowledge
We ask six questions:
- What exactly is in each input? Request the cash-flow reconciliation, ARR policy, and ARR waterfall. Record any exclusions.
- What do two time windows show? Compare the latest quarter with trailing 12 months. Then look at at least four consecutive quarters calculated the same way.
- Is the company still growing fast enough? A falling burn multiple alongside collapsing ARR growth may reflect cuts rather than a healthier engine.
- What is the quality of that growth? Pair the ratio with gross margin, gross and net revenue retention, customer concentration, customer acquisition cost (CAC) payback, and cohort behavior. Our unit-economics guide shows how to read those drivers.
- What caused the change? Separate lower burn from higher new-logo ARR, expansion, contraction, and churn. A founder should be able to connect the movement to specific operating decisions.
- What will the next dollar fund? Map planned spend to a measurable milestone and a runway buffer. A temporarily high multiple is easier to underwrite when the investment has a clear purpose, leading indicators, and a stop condition.
Consider a company whose quarterly trend moves from 2.8x to 1.7x to 1.25x. Net burn falls from $1.4 million to $1.2 million to $1 million, while net new ARR rises from $500,000 to $700,000 to $800,000. That is stronger evidence than a one-quarter 1.25x result because both sides improve.
The next diligence question is why. Lower churn and rising expansion with stable gross margin suggest healthier growth. One annual prepayment and delayed hiring suggest timing. The ratio points to the question; the operating data answers it.
Burn multiple belongs inside a broader due diligence process, alongside the founder, product, customer evidence, financing terms, and price.
The investor takeaway
Burn multiple is most useful when three conditions hold: recurring revenue is defined consistently, cash burn and ARR growth cover the same period, and net new ARR is positive enough to make the ratio stable.
Keep the raw inputs beside the multiple. Track the trend. Pair it with growth, retention, gross margin, CAC payback, and runway. Then ask whether the company's spending is creating durable customer pull or temporarily buying a number.
Startup investments remain risky and illiquid even when the metric looks excellent. The real diligence output is a defensible explanation of how cash becomes recurring revenue, where that process can break, and what evidence would change your view.
If you want to build that judgment with experienced operators and fellow investors, apply to Angel Squad.















.png)