Startup financial projections: an investor's guide
Brian Nichols is the co-founder of Angel Squad, an angel investing community where aspiring and active angels learn from Hustle Fund’s approach, review curated deal flow, and connect with peers.
Startup financial projections can look precise long before the business is predictable. Founders need them to plan hires and cash. Angels need them to see which claims drive the plan and what breaks first.
A useful model connects customer behavior to revenue, expenses, cash, and runway. Here is how to build that chain and assess it without confusing precision for certainty.
What startup financial projections should do
A projection turns operating assumptions into a view of future financial results. For an early-stage company, it should answer five practical questions:
- What creates revenue?
- What does it cost to deliver the product and operate the company?
- Which hires and other commitments enter the plan, and when?
- How does activity change the cash balance?
- Which milestone can the company reach before it needs more money?
The forecast horizon should match the decision. A cash-constrained startup needs detailed monthly visibility through its next major milestone and financing decision. A strategic view can extend farther with less detail. Treat the distant periods as a direction built from assumptions, rather than a promise.
Build the model in this sequence
Start with the mechanics of the business. Our co-founder and general partner Elizabeth Yin wrote, “Going back to first principles is super important since the market always changes and evolves.” That guidance from Elizabeth Yin, Democratizing Knowledge (Hustle Fund, 2021) applies directly to projections. A benchmark can inform an assumption, but it cannot replace the startup's own pricing, sales motion, customer behavior, or cost structure.
1. Create one assumptions register
List each input once, with its unit, source, owner, and date. Separate evidence from judgment.
- Observed: current price, signed contracts, payroll, cloud bills, historical churn, collection timing.
- Tested: pilot conversion, sales-cycle length, channel cost, usage per customer.
- Unproven: future close rates, price increases, new-channel performance, hiring productivity.
An investor should be able to change one assumption and see its effect. If the founder typed the same growth rate into 20 cells, the model hides both the logic and the risk.
2. Build revenue from operating drivers
Choose drivers that match the business model. Subscription revenue might start with active customers × average price, then account for new customers, expansion, contraction, and churn. A marketplace might use buyers × purchase frequency × order value × take rate. A hardware company might use units shipped × price, constrained by production capacity.
Build acquisition from the sales motion as well. Leads × conversion rate × sales capacity is easier to examine than “revenue grows 15% every month.” The driver model exposes whether the company needs more demand, better conversion, higher prices, or more capacity.
3. Separate direct costs from operating expenses
Direct costs rise with delivery. They can include payment processing, hosting tied to usage, support labor, inventory, fulfillment, or contractor costs attached to a sale. Subtracting them from revenue gives gross profit.
Operating expenses support the company as a whole. Group payroll, sales and marketing, software, rent, insurance, and professional services in useful categories. Keep one-time purchases visible instead of smoothing them into a friendly monthly average.
4. Time the hiring plan by month
Headcount should come from work the company needs to perform. Include the start month, salary, payroll taxes, benefits, recruiting cost, equipment, and ramp time. A signed offer is a firmer cash commitment than an open role.
Annual salary divided by 12 is only the beginning. A model that adds five employees to the operating plan but omits their full cash cost overstates runway.
5. Convert activity into cash movement
Revenue and cash collections can land in different months. So can expenses and payments. Map invoice dates, customer payment terms, annual prepayments, vendor terms, equipment purchases, taxes, debt payments, and financing separately.
Prospective financing belongs in a scenario, clearly labeled. It should not rescue the base cash balance as if the money were already in the bank.
6. Calculate burn, runway, and the cash floor
Net burn is the cash used by operations during a period after operating cash inflows. A basic static runway estimate is available cash ÷ current monthly net burn. It is a snapshot, because hiring, collections, and other cash movements change.
Plot closing cash month by month. Add a cash floor that triggers a decision, such as delaying a hire or starting a financing process. For more detail on how an investor can interpret that timeline, see our guide to founder runway.
How the income statement, cash-flow statement, and balance sheet connect
The three statements tell different parts of the same story. The income statement shows revenue, expenses, and profit or loss over a period. The cash-flow statement explains how operating, investing, and financing activity changed cash. The balance sheet shows assets, liabilities, and equity at a point in time.
The links between them matter:
- Net income starts the operating section of an indirect cash-flow statement, then non-cash items and working-capital changes bridge profit to operating cash.
- Equipment purchases use cash but usually reach the income statement over time through depreciation.
- Debt or equity financing increases cash on the balance sheet and appears in financing cash flow, rather than revenue.
- Closing cash on the cash-flow statement must equal cash on the closing balance sheet.
- The period's profit or loss affects equity through retained earnings or accumulated deficit.
The SEC's financial-statement guide provides plain-language definitions and explains why cash flow is related to, yet different from, net income.
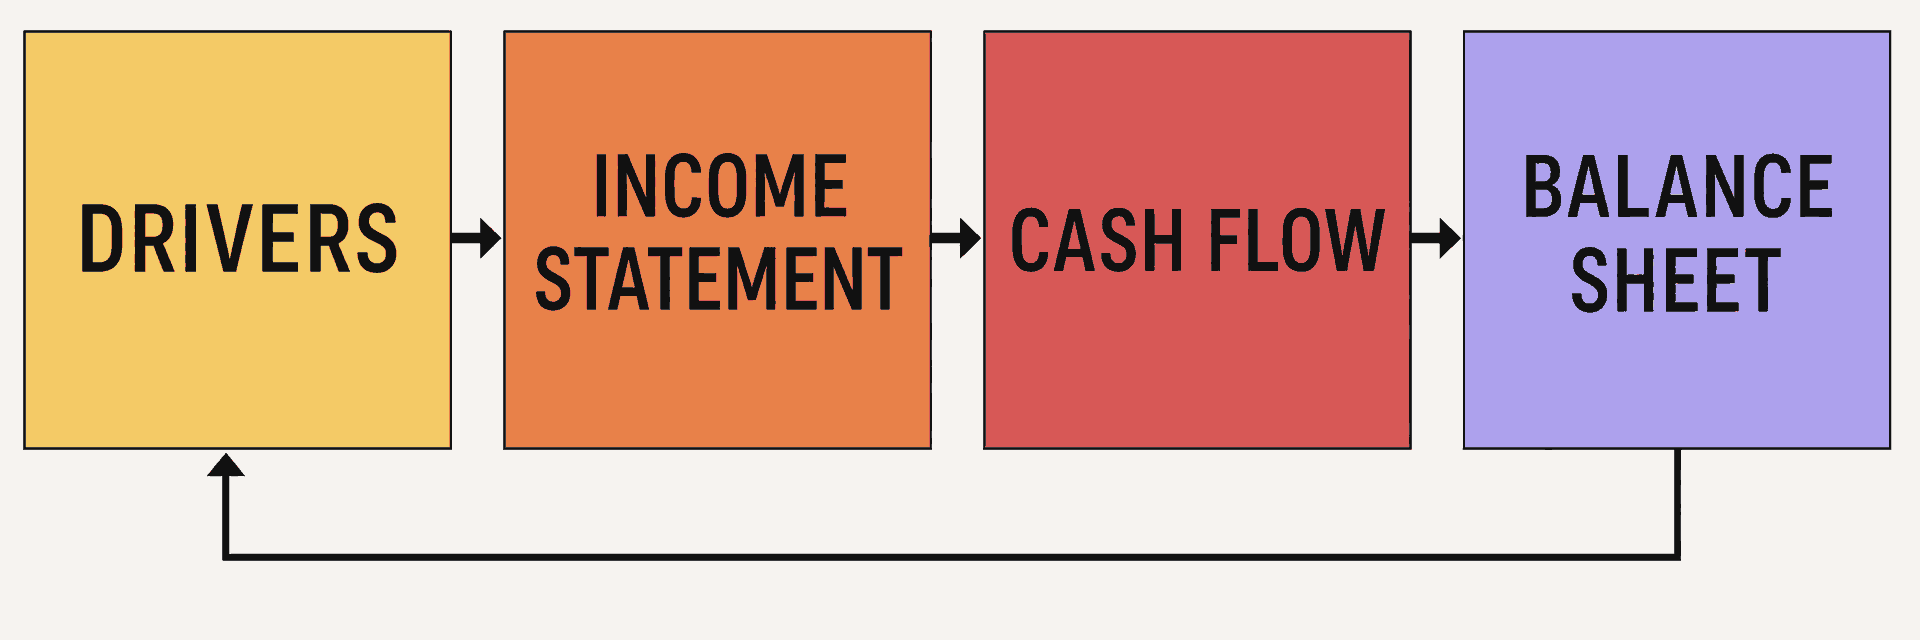
The return arrow matters. Actual results should update drivers and assumptions for the next forecast.
An early-stage operating model can be lean, but it still has to tie. If closing cash changes on one sheet and not another, the investor cannot tell whether the runway is real or a spreadsheet error.
A transparent, reconciled example
Consider a hypothetical, simplified subscription startup for one month. It has 120 active customers throughout the month, and each pays $500. Assume every customer pays in the same month, every expense is paid in the same month, and there are no taxes, receivables, payables, capital purchases, debt, financing flows, or non-cash expenses.
The income statement works as follows:
- Revenue: 120 customers × $500 = $60,000.
- Direct costs: 20% of revenue = $12,000.
- Gross profit: $60,000 − $12,000 = $48,000.
- Payroll and benefits: $95,000.
- Marketing: $18,000.
- Software, rent, insurance, and professional services: $17,000.
- Total operating expenses: $130,000.
- Net loss: $48,000 − $130,000 = $82,000.
Because the cash timing matches the accounting timing in this stripped-down example, operating cash flow is negative $82,000. The company starts with $1,000,000 in cash and ends with $918,000:
$1,000,000 − $82,000 = $918,000
The statements reconcile. Cash falls by $82,000 on the cash-flow statement and by the same amount on the balance sheet. If cash is the only asset and the company has no liabilities in this teaching example, equity also falls from $1,000,000 to $918,000 after the loss.
Current burn suggests 11.2 months of static runway:
$918,000 ÷ $82,000 = 11.2 months
Now add a planned hire with a $15,000 monthly cash cost. Forward net burn becomes $97,000, and forward runway falls to about 9.5 months:
$918,000 ÷ $97,000 = 9.5 months
The second figure is more useful for a hiring decision. Both figures remain estimates. Slower collections, customer churn, an annual insurance payment, a delayed hire, or new financing would change them.
This example is hypothetical and simplified for education. It is not a forecast for any company and does not include all accounting entries, taxes, financing terms, or operating risks.
Build base, downside, and upside scenarios that lead to decisions
Each scenario should change a small set of meaningful drivers and carry those changes through all three statements. Three copies of the same model with arbitrary revenue percentages do not reveal much.
- Base case: Use the operating assumptions the team considers most likely, supported by current evidence.
- Downside case: Slow acquisition, lower conversion, higher churn, delayed collections, or longer hiring ramp. State the cash floor and the action it triggers.
- Upside case: Increase demand or retention, then include the delivery, support, inventory, and hiring costs needed to serve it. Faster growth can consume more cash.
Set triggers in advance. If qualified leads stay below a threshold for two months, pause the next sales hire. If retention beats the target and support capacity holds, release the next product hire. The scenario earns its place when it changes a decision.
The line “Decisions are never in isolation - they are a comparison game.” comes from Elizabeth Yin, Democratizing Knowledge (Hustle Fund, 2021). An investor is comparing uses of cash, milestones, downside exposure, and other opportunities. The model makes those tradeoffs visible.
Use actual-versus-plan reviews to learn
A model improves when the team preserves the original plan and explains the variance. Replace old forecasts with new numbers, and the learning disappears.
Run a regular review with five steps:
- Lock the approved plan for the period.
- Load actual results from the books, bank, payroll, billing, and sales systems.
- Calculate the dollar and percentage variance for each major driver.
- Explain the operating cause. “Revenue missed” is an outcome. Fewer leads, lower conversion, delayed launches, churn, and late collections are causes.
- Reforecast future periods and record the decision, owner, and date.
An investor should care about the quality of the explanation as much as the miss. A founder who spots a bad assumption, updates the model, and changes a decision is producing evidence about the team's learning speed.
An angel investor's projection rubric
Use the same questions across deals so confidence in a founder does not quietly change the standard. Early-stage judgment stays subjective, but a repeatable rubric makes the reasoning easier to inspect and improve.
- Driver clarity: Can you move from customer activity to revenue without a hidden growth plug?
- Evidence quality: Which assumptions are observed, tested, or unproven? Are they dated?
- Statement integrity: Do profit, cash movement, and the closing balance sheet reconcile?
- Cash realism: Does the model include collection timing, working capital, one-time payments, capital spending, and financing separately?
- Hiring logic: Does each role have a start date, full cash cost, ramp period, and operating purpose?
- Scenario usefulness: Do downside and upside cases change decisions, or only the chart?
- Milestone fit: Does the cash plan reach a specific milestone with room to measure it and choose the next financing path?
- Learning loop: Does the founder preserve plan versus actual results and update assumptions from evidence?
Projections are one part of diligence. A coherent model can still sit beside weak customer evidence, legal issues, poor governance, or an unattractive deal. Our startup diligence checklist covers the wider review, while our pre-seed framework helps when operating data is scarce.
Startup investing is speculative, illiquid, and risky. A company can miss every case in the model, and an investor can lose the full check. Scenario analysis improves the questions. It does not make the outcome safe.
Common projection mistakes
- Starting with market share: “We will win 1% of a huge market” skips the path from leads to customers and capacity.
- Mixing bookings, revenue, and cash: A signed contract, recognized revenue, and collected cash can happen at different times.
- Hard-coding totals: Repeated manual inputs break sensitivity analysis and hide errors.
- Understating hiring cost: Salary without taxes, benefits, equipment, recruiting, or ramp time leaves cash out.
- Treating fundraising as guaranteed: An expected round can be delayed, smaller, or absent.
- Ignoring growth costs: Upside revenue may require more inventory, infrastructure, support, or sales capacity.
- Showing one smooth path: A single case conceals which assumptions threaten cash and milestones.
- Erasing misses: Overwriting the old plan prevents the team and investors from learning which drivers failed.
Practice the review before you write the check
If you want to assess models alongside peers and learn from Hustle Fund's approach to early-stage investing, apply to Angel Squad.