Public market equivalent: a practical guide for angels
Brian Nichols is the co-founder of Angel Squad, an angel investing community where aspiring and active angels learn from Hustle Fund’s approach, review curated deal flow, and connect with peers.
Your startup portfolio can gain value while falling behind public stocks. Comparing the two gets tricky when you write checks years apart, invest again in a follow-on round, and receive only part of your money back. Public market equivalent gives those uneven cash flows a common benchmark. The useful work is choosing inputs and understanding the result’s limits.
What public market equivalent measures
Public market equivalent (PME) is a family of methods for comparing private-investment cash flows with a public-market index over matching dates. You apply the index’s actual returns to the dollars paid in and received, then compare the results under a named method.
For an angel investor, the comparison begins with each startup check. It can cover one deal, a group of deals, or your whole angel portfolio. A public index supplies an opportunity-cost benchmark for the same cash-flow schedule.
Our co-founder and general partner Elizabeth Yin writes in Democratizing Knowledge, “Decisions are never in isolation - they are a comparison game.” PME puts numbers around one historical comparison. It can’t establish whether a startup’s risks were worth taking.
Two methods produce different kinds of answers:
- Kaplan–Schoar PME (KS-PME): A ratio of index-adjusted proceeds and remaining value to index-adjusted contributions. Above 1 means the private stream exceeded the chosen benchmark on this measure; below 1 means it fell short.
- Original Long–Nickels PME: A hypothetical index account that buys with each contribution and sells to fund each distribution. Its annualized internal rate of return (IRR) is compared with the private investment’s IRR.
A KS-PME ratio and a Long–Nickels percentage belong to different methods. Label the variant whenever you report it.
Build the cash-flow record before calculating
A spreadsheet needs dated transactions and a separate record of what you still own. Our portfolio management guide covers the broader tracking system. For PME, these are the inputs that matter.
Set one reporting boundary
Choose the deal or portfolio, measurement date, currency, and gross or net basis first. An investor-level result uses the cash you paid, cash you received, and remaining value attributable to you after the costs included in that basis.
For an investment through a special purpose vehicle (SPV), use your contributions, distributions, and remaining interest in the vehicle. Counting that interest and the underlying startup shares again would duplicate the same investment.
For a portfolio result, pool the dated cash flows and remaining values, then calculate one ratio. A simple average of company-level PMEs gives a small check the same influence as a large one.
Elizabeth writes in Democratizing Knowledge, “Don't try to pick a co. Select a portfolio.” That advice applies to the reporting boundary, too. Keep failed investments in the record. A winners-only calculation describes a different portfolio.
Separate cash movements from valuation changes
Record each event according to what happened:
- Initial checks and follow-ons: Each payment is a contribution on its own date. A follow-on doesn’t inherit the original check’s date.
- Exit proceeds and other cash receipts: Each distribution is a positive cash flow when received. A partial sale leaves a smaller remaining position.
- Write-ups and write-downs: These change the estimated value still held. They aren’t distributions.
- Remaining value: Record net asset value (NAV), the estimated value attributable to the unsold investment, at the measurement date. Exclude stakes already sold and cash already counted as distributed.
- Fees and carried interest: For a net investor result, include applicable cash costs and use distributions and NAV after the deductions required by that reporting basis. Carried interest is a share of profits determined by the vehicle’s terms.
Promised exit proceeds and announced acquisitions are not cash receipts. Noncash distributions need an explicit valuation and recognition convention rather than silently entering a cash-only ledger.
Choose a total-return benchmark
Use a total-return index, which includes reinvested dividends, in the same currency as the cash flows. A price-only index leaves dividends out of the public alternative.
A broad U.S. equity index can frame a U.S. stock-market comparison. A global index answers a different geographic question. Choose the benchmark for the role startup investments play in your portfolio and retain that choice across reviews.
Save the full index name, series, currency, and levels for every transaction date and the measurement date. For weekends or holidays, apply a documented convention, such as the preceding trading day’s close. Shifting a payment to quarter-end changes its exposure to public-market returns.
Calculate Kaplan–Schoar PME
KS-PME adjusts each contribution and distribution using the benchmark’s return from that transaction date to the measurement date. It then compares the totals. Kaplan and Schoar’s original research used the S&P 500’s total return for the adjustment.
Use these symbols:
- C_t: A contribution on date t, expressed as a positive amount.
- D_t: A cash distribution on date t, also expressed as a positive amount.
- I_t and I_T: Total-return index levels on transaction date t and measurement date T.
- NAV_T: Remaining private-investment value at T.
The formula is:
- A = Σ [C_t × (I_T ÷ I_t)].
- B = Σ [D_t × (I_T ÷ I_t)].
- KS-PME = (B + NAV_T) ÷ A.
The Σ symbol means add all relevant transactions. A is the contributions grown at the index return; B is the distributions grown at that return. NAV_T is already measured at T, so it receives no further index adjustment.
For an unfinished investment, including NAV treats the mark as a terminal value for the calculation. It remains unrealized. For a fully exited investment with nothing left, NAV_T is zero.
Hypothetical worked example with a follow-on and partial exit
This simplified example covers one direct startup investment as of January 2, 2026. It is gross, before fees, expenses, carried interest, and taxes. All dates, amounts, and index levels are invented, not historical market data or a projection. The calculation includes every initial and follow-on dollar, one realized cash receipt, and an unrealized remaining-share mark. It assumes U.S. dollars, no borrowing, no noncash distributions, and frictionless benchmark exposure.
The record contains four entries:
- January 3, 2022: You invest $10,000. The hypothetical total-return index is 100.
- July 3, 2023: You invest another $5,000 in a follow-on. The index is 115.
- April 1, 2025: You receive $12,000 from a partial exit. The index is 145.
- January 2, 2026: Your unsold shares have an estimated value of $8,000. The index is 160. This entry is a valuation, not cash received.
First, adjust both checks to the measurement date:
- Initial check: $10,000 × (160 ÷ 100) = $16,000.00.
- Follow-on: $5,000 × (160 ÷ 115) = $6,956.52.
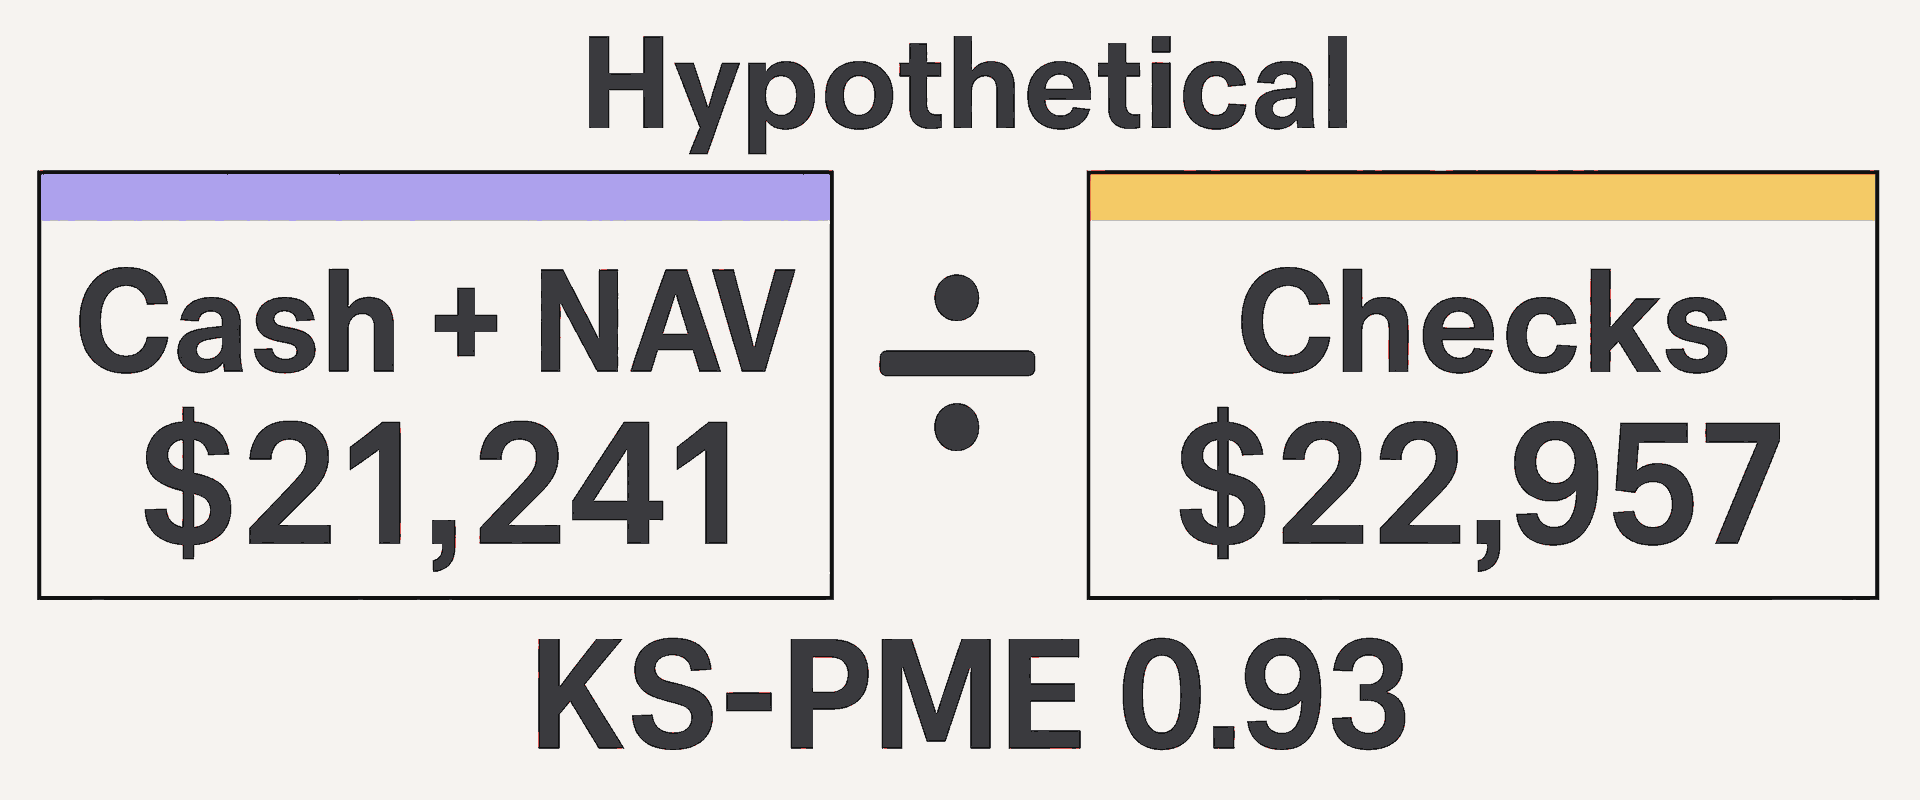
- Total adjusted contributions: A = $22,956.52.
Next, adjust the cash distribution and add the remaining mark:
- Cash receipt: $12,000 × (160 ÷ 145) = $13,241.38.
- Remaining NAV: $8,000.00.
- Combined value: B + NAV = $21,241.38.
- KS-PME: $21,241.38 ÷ $22,956.52 = 0.9253.
Rounded to 0.93, this hypothetical KS-PME falls below 1. The private proceeds and mark fall short of the hypothetical benchmark-adjusted contributions.
The same deal has a gross multiple on invested capital (MOIC) of ($12,000 + $8,000) ÷ $15,000, or 1.33x. It has more reported total value than invested cost, yet trails this index comparison. Only $12,000 has come back in cash; $8,000 remains an estimate.
Our MOIC formula guide explains that amount-of-money comparison. KS-PME adds the public-market context for the actual payment dates.
Show how much the result depends on the mark
Keeping every other assumption in this hypothetical example unchanged, a remaining NAV of $9,715.14 would bring KS-PME to approximately 1. Each $1,000 change in NAV changes the ratio by about 0.044.
That sensitivity shows how a revised mark can move an unfinished investment across the benchmark threshold without another dollar reaching your bank account. The break-even figure is a calculation output, not evidence that the shares are worth that amount.
How original Long–Nickels PME differs
The original Long–Nickels method, also called the Index Comparison Method, tracks a synthetic public account. Each contribution buys index exposure; each distribution withdraws the same dollar amount from that account.
Its balance evolves as:
V_t = V_previous × (I_t ÷ I_previous) + C_t − D_t.
V is the hypothetical public-account balance. At the measurement date, calculate two dated IRRs. Both use negative contributions and positive distributions. The private calculation ends with private NAV; the benchmark calculation ends with V_T.
On the same hypothetical, simplified, gross, pre-tax direct-deal example above, the public account ends with:
V_T = $22,956.52 − $13,241.38 = $9,715.14.
The private investment has $8,000 remaining instead. Using XIRR, a date-based IRR calculation with actual days divided by 365, the private stream produces about 9.84% annualized and the Long–Nickels benchmark stream about 12.66% annualized. The KS-PME of 0.93 is a ratio, not either of those annualized percentages.
Long–Nickels has a practical limitation. Large private distributions can exhaust the synthetic public account and push its balance negative. The benchmark then implies a short or borrowing position, so an ordinary funded-account interpretation breaks down. Cambridge Associates’ benchmarking framework explains this problem and distinguishes the two methods.
KS-PME avoids constructing that negative account balance. It still has valuation, benchmark, and interpretation limits.
What a PME result can and cannot tell you
PME is useful for reviewing historical capital allocation. Several limits belong beside the number:
- A ratio is not an annual return: KS-PME of 1.20 means the index-adjusted numerator is 1.20 times its denominator. It does not mean 20% annual outperformance. Ratios from portfolios with different cash-flow schedules also do not rank the size of their economic gains reliably.
- Risk remains different: A few startup holdings and a diversified public index have different concentration, failure, and liquidity risks. KS-PME supplies no automatic adjustment for those differences. Kaplan and Schoar’s original comparison excluded systematic-risk adjustments.
- Marks can lag: Public prices move daily; startup valuations can depend on older information. A stale mark paired with a current index creates a mismatched comparison. Record the valuation’s source date, policy, security rights, and subsequent information alongside the measurement date.
- The endpoint matters: A short comparison window can move sharply with public markets or one private valuation change. A young portfolio’s PME can be calculated without being a reliable guide to its eventual outcome.
- Costs change the question: Gross deal performance excludes costs that an investor-level net result includes. An index series also omits some costs of holding an actual investment product. State fees, expenses, carry, and tax exclusions on both sides.
- Undeployed reserves sit outside the calculation: Matching paid-in checks does not measure the return on cash you held aside for future deals. PME therefore cannot describe your entire startup allocation unless that broader cash-management policy is modeled separately.
- Peer ranking is separate: Beating a stock index does not establish where you rank against venture funds. Fund comparisons need compatible vintages, strategies, fees, reporting dates, and valuation conventions. Our TVPI guide explains total value to paid-in capital, the fund multiple often reported alongside IRR.
The hypothetical index exposure is a benchmark construct. It doesn’t prove that every matching trade was available to you, compensate you for being unable to sell startup shares, or predict the next exit. Startup investing is speculative, illiquid, and long-term. Most bets may fail, and you can lose everything invested.
Keep the comparison useful at the next review
Save the dated ledger, named index series, measurement date, fee basis, and valuation assumptions with each PME result. Report cash received and remaining marked value separately. Keep MOIC and IRR beside PME so the review shows dollars, timing, and the public-market comparison without asking one metric to answer all three questions.
For an unfinished portfolio, explain changes through new checks, distributions, mark revisions, and benchmark movements. A higher ratio caused by a write-up deserves a different reading from cash arriving after an exit.
If you want to build your portfolio judgment alongside other operators, apply to Angel Squad. Our angel-investing community combines education from Hustle Fund’s investing approach, curated deal flow, and peer discussion while you make your own investment decisions.
This material is educational and is not investment, legal, tax, accounting, or valuation advice. Examples are hypothetical and simplified, not projections. Startup investments are speculative, illiquid, long-term, and can result in total loss. Past results and current marks do not guarantee future results. Actual results depend on governing documents, fees, expenses, carried interest, taxes, cap-table rights and preferences, valuation policies, and transaction and reporting timing. Use the governing documents with qualified independent investment, legal, tax, accounting, and valuation advisers for transaction-specific decisions.